Machine Learning-Based Penetrance of Genetic Variants
Limitations in current methods of variant interpretation
Traditional penetrance estimates rely on small, disease-enriched cohorts → ascertainment bias
Patients are classified in a binary manner - case/control, sick/healthy, etc. while ignoring the fact that diseases exist on a spectrum
Studies with smaller scope cannot assess rare variants with significant accuracy
Difficult to interpret if Variants of Uncertain Signifance (VUS) are associated with disease pathogenecity or are harmful
Research Question
Given a genetic variant exists in a patient, can machine learning and statistical methods predict what is its penetrance?
Methodology
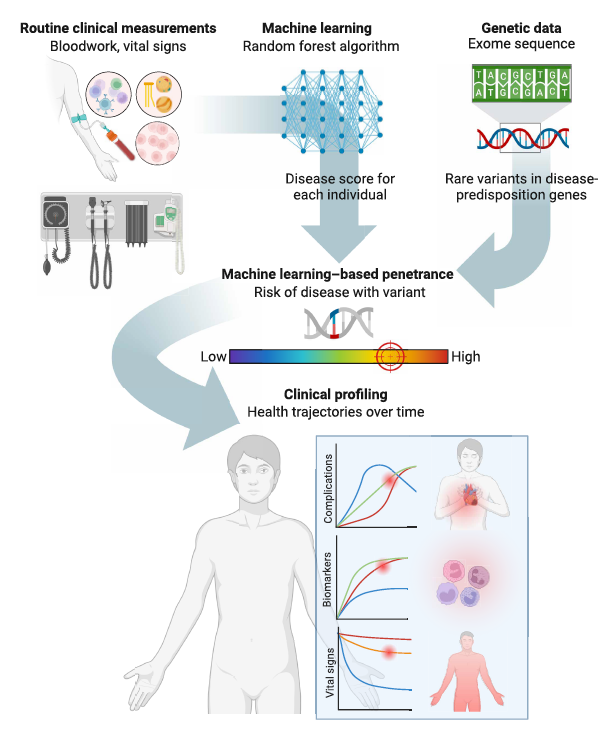
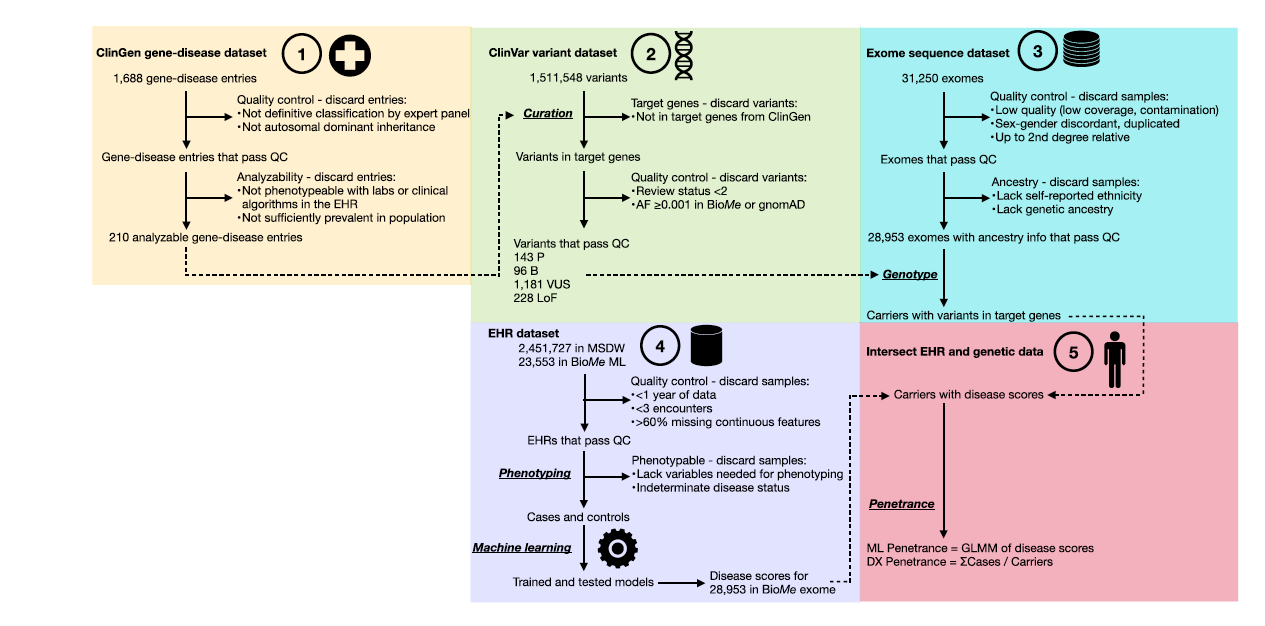
Development, testing, and application of disease-predictive ML models to generate disease scores
Identification of individuals carrying rare P variants in genes corresponding to 10 dominant genetic conditions
- Arrhythmogenic Right Ventricular Cardiomyopathy (ARVC)
- Familial Breast Cancer (FBC)
- Familial Hypercholesterolemia (FH)
- Hypertrophic Cardiomyopathy (HCM)
- Adult Hypophosphatasia (HPP)
- Long QT Syndrome (LQTS)
- Lynch Syndrome (LS)
- Monogenic Diabetes (MD)
- Polycystic Kidney Disease (PKD)
- von Willebrand Disease (VWD)
- Computation and characterization of ML penetrance
Methodology
The disease scores can be used as a continuous measure of measuring odds of disease.
Instead of
“you have the variant, you might get sick”
the model will allow us to predict
“you have this variant, based on the data, you risk for disease is x%”
Data
| Cohort | N Participants | Purpose | Median Age |
|---|---|---|---|
| MSDW | 1,325,257 | Model training & validation | 55 years |
| BioMe ML | 22,041 | Model testing (holdout) | 56 years |
| BioMe Exome | 28,953 | Penetrance assessment | 65 years |
Workflow
Prediction Model Features
Input Features (47 lab tests + 9 vital signs)
Routine laboratory measurements (median values)
Complete blood count, metabolic panel
Lipid profiles, liver/kidney function
Vital signs (BP, heart rate, BMI)
Demographics (age, sex, ancestry)
Predictive Performance of ML Models
| Metric | MSDW (Internal) | BioMe (Holdout) |
|---|---|---|
| Mean AUROC | 0.85 (0.77-0.95) | 0.84 (0.79-0.95) |
| Sensitivity | 0.77 (0.70-0.87) | 0.78 (0.74-0.88) |
| Specificity | 0.78 (0.68-0.91) | 0.78 (0.67-0.92) |
Example:
FH model identified LDL-C, total cholesterol, age, and HDL-C as most important features
Glucose, age, body mass index (BMI), and glomerular filtration rate (GFR) were the most important features for the MD models
ML Penetrance Evaluation
- Apply ML models to generate continuous disease probability scores (0-1)
- Use Generalized Linear Mixed-Effects Model (GLMM) to compute penetrance
- Accounts for variability between carriers and across ML iterations
logit-transformed disease scores from all 50 ML iterations in all carriers, which accounted for variability in scores between different carriers (random effects term) and variability in scores between different ML iterations within the same individual (residual random effects term)
The model’s inverse logit coefficients and error terms were then used to provide a point estimate of ML penetrance, 95% confidence interval (95% CI), and p-value
ML Penetrance Results
| Finding Category | Key Results | Statistical Significance |
|---|---|---|
| Pathogenic vs. Benign Variants | Pathogenic variants: median ML penetrance = 0.52 (IQR 0.38) Benign variants: median ML penetrance = 0.28 (IQR 0.22) |
p-value = 6.1 × 10⁻⁸ |
| Rare vs. Common Variants | Rare variants (AF <0.001): median penetrance = 0.46 Common variants (AF ≥0.001): median penetrance = 0.28 |
p-value = 8.9 × 10⁻⁴⁸ |
ML Penetrance Results
| Finding Category | Key Results | Statistical Significance |
|---|---|---|
| Clinical Outcome Correlation - PKD | Per 0.1 increase in ML penetrance: • Chronic kidney disease: OR = 1.11 • End-stage renal disease: OR = 1.09 • Secondary hypertension: OR = 1.05 |
p-value = 2.9×10⁻¹³ p-value = 4.7×10⁻¹³ p-value = 1.3×10⁻⁸ |
| Clinical Outcome Correlation - FH | Myocardial infarction: OR = 1.02 per 0.1 ML penetrance increase | p-value = 2.4×10⁻³ |
ML Penetrance Results
| Finding Category | Key Results | Statistical Significance |
|---|---|---|
| Functional Validation - BRCA1 | 0.01 increase in ML penetrance → 0.027 decrease in DNA repair function score | p-value = 2.9×10⁻³ |
| Functional Validation - LDLR | Higher ML penetrance correlated with reduced LDL uptake | r = -0.76, p-value = 0.021 |
| Functional Validation - KCNQ1 | Higher ML penetrance → 303-ms increase in deactivation time | p-value = 9.1×10⁻³ |
ML Penetrance Results
| Finding Category | Key Results | Statistical Significance |
|---|---|---|
| Model Performance | Mean AUROC: 0.85 (MSDW) and 0.84 (BioMe ML) Mean sensitivity: 0.77-0.78 Mean specificity: 0.78 |
Range: 0.77-0.95 |
| VUS Characterization | VUS median ML penetrance = 0.46 (IQR 0.31) Higher than benign, lower than pathogenic |
p-value = 4.9×10⁻⁸ vs. B p-value = 0.011 vs. P |
ML Penetrance Results
| Finding Category | Key Results | Statistical Significance |
|---|---|---|
| LoF Variants | Median ML penetrance = 0.48 (IQR 0.36) Higher than benign variants 21% had high penetrance ≥0.75, 18% had low penetrance ≤0.25 |
p-value = 5.7×10⁻⁸ |
ML Penetrance Results
| Finding Category | Key Results | Statistical Significance |
|---|---|---|
| UK Biobank Validation | ML penetrance values significantly correlated across BioMe and UK Biobank Strongest correlations: ARVC (R=0.96), MD (R=0.58) |
p-value = 1.8×10⁻³ overall |
Clinical Applications
Improved Variant Classification: Quantitative risk estimates beyond P/LP/VUS categories
Enhanced Risk Stratification: Individualized screening protocols based on ML penetrance
Genetic Counseling: More precise risk communication to patients
Clinical Trial Recruitment: Identify high-penetrance variant carriers
Resource Allocation: Prioritize monitoring for high-risk individuals
Study Strengths
Large-scale: >1.3 million participants with deep phenotyping
Unselected population: Reduced ascertainment bias vs. family studies
Quantitative: Continuous penetrance estimates, not binary
Clinically grounded: Uses routine lab data already in EHR
Validated: Functional data, clinical outcomes, external cohorts
High-throughput: Scalable to other health systems and diseases
Limitations & Future Directions
Limitations:
Dependent on EHR data quality and completeness
Focused on autosomal dominant conditions
Limited diversity in training cohorts
Does not address genetic modifiers or environmental factors
Future Work:
Extend to other inheritance patterns and rare diseases
Develop ancestry-specific models
Prospective studies following variant carriers longitudinally
Integration with functional assays and polygenic risk scores
Key Takeaways
ML-based penetrance provides refined, quantitative disease risk estimates for genetic variants
ML penetrance correlates with clinical outcomes and functional data, validating biological relevance
Enables interpretation of VUS and LoF variants through clinical trajectory analysis
Represents a scalable blueprint for precision medicine using routine EHR data
